Steam Turbine Market To Register High Revenue Growth of US$21.3 Billion Over 2030

The global steam turbine market size was valued at $15.5 billion in 2020, and projected to reach $21.3 billion by 2030, with a CAGR of 3.3% from 2021 to 2030. Increase in demand for thermal power generation and electric supply, surge in energy demand and steady investment for expansion of the power industry, and increase in efforts to reduce energy demand & supply gaps as well as the development in thermal power projects drive the growth of the global steam turbine market. Moreover, increase in regulatory initiatives to minimize carbon emissions as well as increased investments in the development of large-scale thermal power plants in developing countries present new opportunities in the coming years.

The global steam turbine market growth is majorly driven by increase in demand for thermal power generation and electric supply. In addition, rapid oil & gas and power demand in developing countries is expected to boost the growth of the steam turbine market.Furthermore, surge in energy demand and steady investment for expansion of the power industry are expected to have positive impact on the demand and enahnce steam turbine market opportunities. Moreover, the global market is expected to witness notable growth due to increase in efforts to reduce energy demand & supply gaps as well as the development in thermal power projects.

In addition, robust economic growth and regulatory standards promoting the use of low emission fuels such as natural gas & biomass in steam turbines notably contribute toward the market growth. However, implementation of stringent government regulations to reduce reliance on traditional energy sources such as coal-fired power generation and their replacement with renewables hinder the market growth. Moreover, the competitive cost of renewable technologies impedes the growth of the global steam turbine market.

Download Sample PDF (221 Pages PDF with Insights): https://www.alliedmarketresearch.com/request-sample/6028

Based on end use industry, the power generation segment accounted for the largest share in 2020, contributing to nearly half of the global steam turbine market, and is projected to maintain its lead position during the forecast period. Moreover, the same segment is expected to portray the largest CAGR of 3.7% from 2021 to 2030, owing to growth in power plants all over the world. The report also analyzes the segments including petrochemical, oil and gas, others.

Based on region, Asia-Pacific held the highest market share in terms of revenue 2020, accounting for nearly half of the global steam turbine market. Moreover, the same region is expected to witness the fastest CAGR of 3.7% during the forecast period, owing to rise in demand for electricity in the region. Other regions discussed in the report include North America, Europe, and LAMEA.

The key players operating in the global steam turbine market include General Electric (GE) Co., Turbine Generator Maintenance Inc., Toshiba Corporation, Siemens AG, Arani power systems, Elliott Group, TURBOCAM, Doosan Škoda Power, Chola Turbo Machinery International Pvt. Ltd. Triveni Turbines, and Mitsubishi Power. Among these, General Electric (GE) Co., Turbine Generator Maintenance Inc., Toshiba Corporation, Siemens AG, and Mitsubishi Hitachi Power Systems Americas Inc. hold significant steam turbine market share.

For Purchase Enquiry @ https://www.alliedmarketresearch.com/steam-turbine-market/purchase-options

These market players are adopting different strategies such as design launch, partnership, expansion, merger, and acquisition to stay competitive in the market. For instance, in June 2019, Mitsubishi Hitachi Power Systems (MHPS), Ltd. strengthened its presence by expanding its facilities. MHPS Plant Services Corporation, a new company was opened in Philippines to offer services for power generation facilities.

Elliott Group announced merger of Ebara International Corporation, which is based in Sparks, Nevada. Effective from April 1, 2019, the merged entity became one of the four business units within Elliott Group.

IMPACT OF COVID-19 ON THE GLOBAL STEAM TURBINE MARKET

  • The outbreak of COVID-19 had a negative impact on the growth of the steam turbine market.
  • This impact is majorly attributed to significant disruption in the material transportation and dearth in availability of labor, which led to shutdown of manufacturing industry, thus declining the demand for power, which, in tur, resulted in decreased demand for steam turbines.
  • Moreover, decrease in demand for many nonessential products and shut down of electrical, automotive, and other manufacturing industries created a negative impact on the development of the steam turbine market.
  • Furthermore, surge in demand for environment-friendly power generation and increase in awareness toward the environment hampered the growth of the market.
  • Thus, the abovementioned factors are expected to have a negative impact on the development of steam turbine market.
  • On the contrary, presently, all activities have started normally as the COVID cases have reduced drastically due to the vaccination drive. This drive has led to normal operation of various manufacturing industries and continuation of pending power infrastructure. The rapid development of power infrastructure will have positive impact on the development of the steam turbine market.

U.S. Dry Aging Beef Market driving factors, restraints, opportunities, Demand and Forecast

Dry aging beef is a process in which the beef is placed or hung on racks for several weeks to facilitate drying. Primal (large distinct sections) or subprimal cuts, such as strip loins, sirloin, and rib eyes, are placed in refrigeration units to facilitate drying. This process incurs significant expenses, as beef must be stored at near freezing temperatures. Subprimal cuts are dry aged on racks in specially designed climate-controlled coolers. In addition, dry aging can be done in moisture-permeable drybags. This process involves the use of high grade meat with evenly distributed fat content. Hence, dry aged beef is available in steak restaurants and upscale butcher shops or grocery stores.

U.S. Dry Aging Beef Market was valued at $10,446 million in 2015, and is expected to reach $11,176 million by 2020, supported by a CAGR of 1.3% during the forecast period 2016 to 2020.

LIMITED-TIME OFFER – Buy Now & Get Exclusive Discount on this Report

Approximately 6% of the total dry aged beef is sold through online channels in the U.S. The sales through other channels constituted 94% share in the U.S. market in 2015. These channels include supermarkets, hypermarkets, retail shops, food service suppliers, and restaurants.

The rich flavor of dry aging beef is a key driver of the U.S. dry aging beef market. Increase in the number of restaurants and rise in inclination of specialist butchers toward traditional processes are expected to boost the consumption of dry aged beef in the U.S. Dry aging is a natural process wherein beef is kept unwrapped in a conditioned environment of an aging unit. The packaging business has flourished in the U.S., owing to increased production of beef to cater to the augmented demand from international markets and surge in trading business. Moreover, rise in preference for protein-rich products and uniquely flavored products among consumers and increase in disposable income are expected to boost the demand for dry aging beef in the U.S. in the near future.

Request The Free Sample PDF Of This Report (Flash Sale Till 20th August 2022): https://www.alliedmarketresearch.com/request-sample/1892

The key players profiled in the report are DrybagSTeak, LLC., DeBragga, The Ventura Meat Company, Buckhead beef, Chicago Steak Company, and American Grass Fed Beef.

Key Findings of the U.S. Dry Aging Beef Market
The U.S. is expected to be the leading producer and exporter of dry aging beef in 2015 across the globe.

Dry aging beef market in the U.S. is expected to grow at a CAGR of 1.3% in terms of value during the forecast period.

The dry aging beef packaging business in the U.S. is anticipated to grow at a CAGR of 1.7% in terms of value during the forecast period.

The U.S. beef market registered a CAGR of 7.5% in terms of value during 20132015.

Meat packers and meat processors held major share in the U.S. dry aging beef production in 2015.

In 2015, business clients accounted for over two-thirds of the total revenue generated from sales of dry aging beef in the U.S. Business clients include wholesalers, retailers, hypermarket, supermarkets, restaurants, food service outlets, and grocery shops among others.

Request a Discount Before Purchasing Report: https://www.alliedmarketresearch.com/purchase-enquiry/1892

We Can Help! Our Analysts Can Customize This Report to Meet Your Requirements

Reasons to Buy This U.S. Dry Aging Beef Market Report:

> Mergers and acquisitions should be well-planned by identifying the best manufacturer.

> Sort new clients or possible partners into the demographic you’re looking for.

> Suitable for providing dependable and high-quality data and analysis to assist your internal and external presentations.

> Develop tactical initiatives by gaining a better grasp of the areas in which huge corporations can intervene.

> To increase and grow business potential and reach, develop and plan licencing and licencing strategies by finding possible partners with the most appealing projects.

> Recognize newcomers with potentially strong product portfolios and devise effective counter-strategies to acquire a competitive edge.

> To develop effective R&D strategies, gather information, analysis, and strategic insight from competitors

Similar Reports:
Meat Snacks Market: https://www.alliedmarketresearch.com/meat-snacks-market-A05947
Europe Meat Substitute Market: https://www.alliedmarketresearch.com/europe-meat-substitute-market-A09806
Mycoprotein Meat Substitute Market: https://www.alliedmarketresearch.com/mycoprotein-meat-substitute-market
Meat Testing Market: https://www.alliedmarketresearch.com/meat-testing-market-A06677

About Us

Allied Market Research (AMR) is a full-service market research and business-consulting wing of Allied Analytics LLP based in Portland, Oregon. Allied Market Research provides global enterprises as well as medium and small businesses with unmatched quality of “Market Research Reports” and “Business Intelligence Solutions.” AMR has a targeted view to provide business insights and consulting to assist its clients to make strategic business decisions and achieve sustainable growth in their respective market domain.

We are in professional corporate relations with various companies and this helps us in digging out market data that helps us generate accurate research data tables and confirms utmost accuracy in our market forecasting. Allied Market Research CEO Pawan Kumar is instrumental in inspiring and encouraging everyone associated with the company to maintain high quality of data and help clients in every way possible to achieve success. Each and every data presented in the reports published by us is extracted through primary interviews with top officials from leading companies of domain concerned. Our secondary data procurement methodology includes deep online and offline research and discussion with knowledgeable professionals and analysts in the industry.

Wave and Tidal Energy Market Growth Accelerating at a Rapid Pace due to Innovative Strategies

The global Wave and tidal energy market was valued at $0.5 billion in 2020, and is projected to reach $1.3 billion by 2030, with global Wave and tidal energy market forecast expected at a CAGR of 9.4% from 2021 to 2030. Abundance of ocean surface and energy generation capacity in several nations has promoted governments to pursue ocean energy generation as an important source of renewable energy in future. This factor drives the growth of the global wave and tidal energy market. Moreover, rise in governments’ sustainable projects with respect to power generation presents new opportunities in the coming years.

Rising dependency on electricity led to increase the sustainable power generation and wave & tidal energy is one of the sustainable power generation processes, however, government sustainable projects with respect to power generation may act as the major driving factor for the market.

Download Sample PDF (239 Pages PDF with Insights):  https://www.alliedmarketresearch.com/request-sample/2193

The global Wave and Tidal Energy market is segmented on the basis of Type, Technology, Application, and region. Depending on Type, the market is categorized into wave energy and tidal energy. On the basis of Technology, it is divided into Tidal stream generator, Oscillating Water Columns, Tidal turbines, tidal barrages and tidal fences.

Based on application, the power generation segment accounted for the largest share in 2020, contributing to more than four-fifths of the global wave and tidal energy market, and is projected to maintain its lead position during the forecast period. Moreover, the same segment is expected to portray the largest CAGR of 9.5% from 2021 to 2030, owing to its wide usage to produce electricity. The research also analyzes the desalination segment.

Based on region, Europe held the highest market share in terms of revenue 2020, accounting for more than half of the global wave and tidal energy market. Almost half of hydropower plants are in the Balkans and Eastern Mediterranean, where many plants are financed by the EU. This shows the high opportunity for the wave and tidal energy infrastructure in the region.

Request a Discount Before Purchasing Report @ https://www.alliedmarketresearch.com/purchase-enquiry/2193

The global Wave and Tidal Energy market analysis covers in-depth information about the major industry participants. The key players operating and profiled in the report Include Aquagen Technologies, Carnegie Wave Energy Ltd., Corpower Ocean AB., Eco Wave Power, Ocean Power Technologies, Inc, Ocean Renewable Power Company, Pelamis Wave Power, SIMEC Atlantis Energy, Tenax Energy and Verdant Power, Inc.

The global Wave and tidal energy market is analyzed and estimated in accordance with the impacts of the drivers, restraints, and opportunities. The period studied in this report is 2020–2030. The report includes the study of the market with respect to the growth prospects and restraints based on the regional analysis. The study includes Porter’s five forces analysis of the industry to determine the impact of suppliers, competitors, new entrants, substitutes, and buyers on the market growth.

IMPACT OF COVID-19 ON THE GLOBAL WAVE AND TIDAL ENERGY MARKET

  • The COVID-19 pandemic has curtailed the movement of people, goods and technologies worldwide, including in most regions where production of wave and tidal energy system is on large scale. As part of intensifying efforts to contain the spread of COVID-19, a number of local, state and national governments have imposed various restrictions on the conduct of business and travel, such as stay-at-home orders and quarantines that have led to a significant number of business slowdowns and closures. The COVID-19 pandemic has resulted in, and is expected to continue to result in a substantial curtailment of business activities (including the decrease in demand for a broad variety of goods and technologies), weakened economic conditions, supply chain disruptions, significant economic uncertainty and volatility in the financial and commodity markets, including the reduction in global demand for oil and gas combined with excessive supply, due to disagreements between OPEC, both in the U.S. and abroad. However, disruption in such above-mentioned activities led to decrease in demand for wave and tidal energy system and thus, negatively impacted the whole market.
  • The manufacturing of wave and tidal energy system equipment was stopped for a specific period due to high peak of COVID-19 situation, which led to high impact on sales of wave and tidal energy system.
  • COVID-19 impacted almost all industries by hindering various industrial technologies and disrupting the supply chain. Maximum companies halted their technology due to less workforce. However, there is a sluggish decline in the global wave and tidal energy market due to impact of COVID-19.

About us:

Allied Market Research (AMR) is a full-service market research and business-consulting wing of Allied Analytics LLP based in Portland, Oregon. Allied Market Research provides global enterprises as well as medium and small businesses with unmatched quality of “Market Research Reports” and “Business Intelligence Solutions.” AMR has a targeted view to provide business insights and consulting to assist its clients to make strategic business decisions and achieve sustainable growth in their respective market domain.

We are in professional corporate relations with various companies and this helps us in digging out market data that helps us generate accurate research data tables and confirms utmost accuracy in our market forecasting. Allied Market Research CEO Pawan Kumar is instrumental in inspiring and encouraging everyone associated with the company to maintain high quality of data and help clients in every way possible to achieve success. Each and every data presented in the reports published by us is extracted through primary interviews with top officials from leading companies of domain concerned. Our secondary data procurement methodology includes deep online and offline research and discussion with knowledgeable professionals and analysts in the industry.

Residential Heat Pump Market Will Surpass $77.5 Billion By 2030 with at 9.7% CGAR

Global Residential Heat Pump Market,” The residential heat pump market was valued at $33.5 billion in 2021, and is estimated to reach $77.5 billion by 2030, growing at a CAGR of 9.7% from 2022 to 2030. Surge in installation of residential heat pumps in homes for maintaining warm and cool temperature along with adoption of energy and cost efficient systems drive the growth of the residential heat pump market. Moreover, technological advancements are expected to offer lucrative opportunities for the market growth.

Residential heat pumps are widely installed in residential zones for maintaining warm and cool temperature in homes. These are an energy and environment efficient and a popular alternative to air conditioners and furnaces.

Request Sample Here @ https://www.alliedmarketresearch.com/request-sample/16351

The global residential heat pump industry is segmented on the basis of type and power source. By type, the market is classified as air source, water source, and geothermal.

Based on power source, the electric powered segment held the largest market share in 2021, holding nearly three-fourths of the total market share, and is expected to continue its leadership status during the forecast period. Moreover, the same segment is projected to register the highest CAGR of 10.1% from 2022 to 2030. The report also analyzes the air powered segment.

Based on region, Asia-Pacific is contributed to the highest share in terms of revenue in 2021, holding more than one-third of the total market share, and is estimated to continue its dominant share by 2031. Moreover, the same region is projected to manifest the fastest CAGR of 10.3% during the forecast period. Other regions analyzed in the report include North America, Europe, and LAMEA.

The key players profiled in this report include Midea Group, Johnson Controls, Daikin, Carrier Corporation, Glen Dimplex, NIBE, Stiebel Eltron, Viessmann, Mitsubishi Electric Corporation, and Danfoss.

Request a Discount Before Purchasing Report @ https://www.alliedmarketresearch.com/purchase-enquiry/16351

The report focuses on the global residential heat pump market analysis and the major products & applications, where residential heat pumps are used, and roles of different key players that shape the market. Also, the report focuses on the overall demand and residential heat pump market share in various countries, presenting data in terms of both value and volume. The revenue is calculated by proliferating the volume by region-specific prices, considering the region-wise differentiated prices and residential heat pump market trends are studied comprehensively.

Get detailed COVID-19 impact analysis on the Residential Heat Pump Market @ https://www.alliedmarketresearch.com/request-for-customization/16351?reqfor=covid

IMPACT OF COVID-19 ON THE GLOBAL RESIDENTIAL HEAT PUMP MARKET

  • Residential heat pumps are commonly used to warm the interior of homes. However, due to the lockdown and severe controls implemented as a result of the COVID-19 pandemic, heat pump production plants have suffered a significant reduction in 2020, owing to a reduced workforce and a disturbed supply chain.
  • COVID-19 hampered different industrial activities and disrupted the supply chain, affecting practically all industries. Due to a lack of workers, most businesses have shut down. As a result of COVID-19’s influence, the global residential heat pump market forecast has seen a significant drop.
  • According to the United Nations Industrial Development Organization (UNIDO), 30.0%–70.0% of pre-COVID-19 workforce of various industries, such as electrical and other third-party vendors, migrated to their hometowns due to uncertainties and loss of income during the lockdown. This unavailability or less availability of workforce is expected to directly affect the production and manufacturing activities, thereby resulting in decline in the residential heat pump market growth during the forecast period.

Key Findings of the Study

  • On the basis of type, the air source segment dominated the global residential heat pump market in 2021 and is projected to be the fastest-growing segment during the forecast period.
  • On the basis of power source, the electric powered segment dominated the global residential heat pump market in 2021 and is also projected to be the fastest-growing segment during the forecast period.
  • On the basis of region, Asia-Pacific market is projected to grow fast during the forecast period.

About us:

Allied Market Research (AMR) is a full-service market research and business-consulting wing of Allied Analytics LLP based in Portland, Oregon. Allied Market Research provides global enterprises as well as medium and small businesses with unmatched quality of “Market Research Reports” and “Business Intelligence Solutions.” AMR has a targeted view to provide business insights and consulting to assist its clients to make strategic business decisions and achieve sustainable growth in their respective market domain.

We are in professional corporate relations with various companies and this helps us in digging out market data that helps us generate accurate research data tables and confirms utmost accuracy in our market forecasting. Allied Market Research CEO Pawan Kumar is instrumental in inspiring and encouraging everyone associated with the company to maintain high quality of data and help clients in every way possible to achieve success. Each and every data presented in the reports published by us is extracted through primary interviews with top officials from leading companies of domain concerned. Our secondary data procurement methodology includes deep online and offline research and discussion with knowledgeable professionals and analysts in the industry.

Insect Repellent Market to Reach $9,615.7 Million, Globally and by 2026, Growing At 6.8% CAGR From 2019-2026

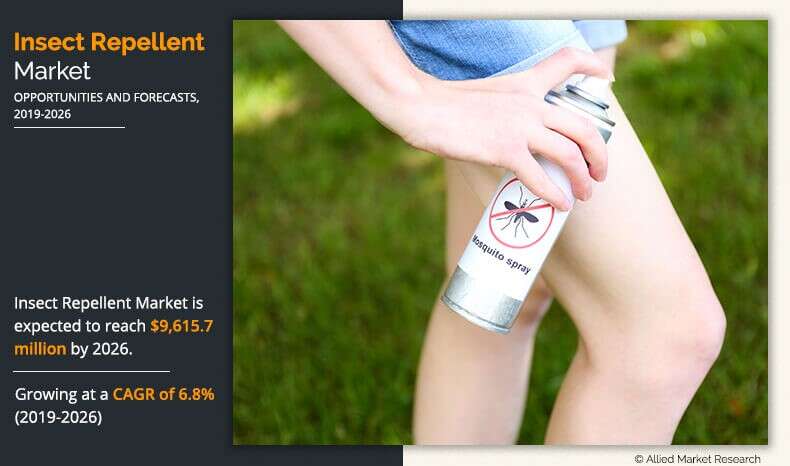
According to a new report published by Allied Market Research, titled, “Insect Repellent Market by Insect Type and Product Type: Global Opportunity Analysis and Industry Forecast, 2019-2026,” the global insect repellent market is expected to generate $ 9,615.7 million by 2026, growing at a CAGR of 6.8% from 2019 to 2026. The report offers an extensive analysis of key growth strategies, drivers, opportunities, key segment, Porter’s Five Forces analysis, and competitive landscape.

In 2018, the vaporizer segment led the insect repellent market, followed by the spray segment. Growth in this segment is supplemented by increase in awareness of insect-borne diseases such as malaria, zika, Lyme disease, dengue, bubonic plague, river blindness, and west Nile fever.

Increase in consumer awareness about insect-borne diseases and different government initiatives for lowering down the ill-effects of insectsdrive the growth of the global insect repellent market. However, availability of toxic chemicals including DEETin mosquito repellent products restrains the market growth. On the other hand, surge in demand for herb-based repellents and creation of commercial repellent products that include plant-based ingredients would offer new opportunities in the next few years.

Request The Free Sample PDF of This Report (Flash Sale Till 20th August 2022): https://www.alliedmarketresearch.com/request-sample/5595

The global temperature of the earth has continued to rise since past few years and is expected to increase more in the coming years, high temperature provides optimum conditions to the mosquitoes to breed and increases their level of activeness. Thus, impact of the rise in global warming would directly impact the growth of mosquito population which would ultimately lead to an increase in the penetration of products designed to repel them. The key market players have consistently engaged themselves into implementing effective marketing strategies aimed toward the promotion of various mosquito repellents. Companies have regularly involved themselves into spreading awareness amongst the people through various awareness campaigns and free sample distribution.

A few companies such as Godrej targeted mothers to promote their sales for ‘Good Knight’ brand through advertising and creating a sense of fear in their minds related to their children getting infected with mosquito borne diseases. This has resulted into an increased sale of various products across the world to prevent diseases. The impact of these innovative marketing strategies are expected to continue to propel the demand for mosquito repellents in future.

The global insect repellent market is classified on the basis of insect type into mosquito, bugs, fly repellent, and others. The mosquito segment dominated the market with the largest share in 2018 and is expected to exhibit significant growth during the insect repellent market forecast period. The rise in incidence of mosquito-borne diseases and global warming, which facilitates breeding of mosquitoes, are the prime factors that are expected to drive the market during forecast period. Other factors that drive the market are rising health awareness, government initiatives for mosquito control, and affordable cost of repellents. However, presence of toxic chemicals, such as DEET, in various mosquito repellent products cause ill effects on health, which are likely to restrain the growth of this market. Huge opportunities prevail for the global repellent market owing to the rise in demand for plant-based repellents and increasing penetration in untapped markets in rural regions.

The key players of the insect repellent industry profiled in this report include:

• Reckitt Benckiser Group
• The Godrej Company
• Dabur International
• Johnson and Johnson
• Spectrum Brands
• Jyothi Labs
• Swayer Ltd.
• Himalaya Herbals
• Enesis Group
• Quantum Health.

Need a Discount? Getting Exclusive Discount And Free Consultation @https://www.alliedmarketresearch.com/purchase-enquiry/5595

Key Findings of the Insect Repellent Market:

• Based on insect type, the mosquito segment was the highest contributor to the global insect repellent market demand in 2018 and is projected to grow at a CAGR of 6.3%.
• Based on product type, the vaporizer insect repellent market size is expected to grow at the highest CAGR of 7.0% from 2019 to 2026.
• Based on product type, the spray segment is expected to grow at a CAGR of 7.5% from 2019 to 2026.
• Based on region, Asia-Pacific insect repellent market size is projected to grow at a CAGR of 8.8% from 2019 to 2026.
• China held the largest market insect repellent market share of 42.4% in 2018 and is expected to grow at a CAGR of 8.6% from 2019 to 2026.
• In terms of value, Asia-Pacific and LAMEA collectively contributed a 59.5% share to the global insect repellent market in 2018. 

About Allied Market Research:

Allied Market Research (AMR) is a full-service market research and business-consulting wing of Allied Analytics LLP based in Portland, Oregon. Allied Market Research provides global enterprises as well as medium and small businesses with unmatched quality of “Market Research Reports” and “Business Intelligence Solutions.” AMR has a targeted view to provide business insights and consulting to assist its clients to make strategic business decisions and achieve sustainable growth in their respective market domain.

Contact us:

David Correa
5933 NE Win Sivers Drive
205, Portland, OR 97220
United States
USA/Canada (Toll Free):
+1-800-792-5285, +1-503-894-6022|
UK: +44-845-528-1300 |
Hong Kong: +852-301-84916 |
India (Pune): +91-20-66346060 |
Fax: +1-855-550-5975
Email: help@alliedmarketresearch.com

U.S. Home Furniture and Bedding Market Size to Rise $183,489.52 Million by 2027, Growing At 3.7% CAGR From 2021-2027

According to a new report published by Allied Market Research, titled U.S. Home Furniture and Bedding Market by Product Type (Sofa, Bed, Chair, Cupboard, and Others) and Sales Channel (Online and Offline),: Opportunity Analysis and Industry Forecast, 2021–2027. The U.S. home furniture and bedding market size is expected to reach $183,489.52 million by 2027, registering a CAGR of 3.07% from 2021 to 2027.

Furniture is the vital part of home, which offers convenience and aesthetic view to the living room, bedroom, and kitchen. The trend of refurbishing and renovating of homes has been gaining high traction in the U.S., which notably contributes toward the market growth. In addition, increase in expenditure on home improvement and décor is expected to increase U.S. home furniture and bedding market share during the forecast period.

LIMITED-TIME OFFER – Buy Now & Get Exclusive Discount on this Report: (Get Customized Reports)

The U.S. home furniture and bedding market is segmented into product type and sales channel. On the basis of product type, the market is categorized into sofa, bed, chair, cupboard, and others. By sales channel, it is segregated into online and offline.

According to U.S. home furniture and bedding market analysis, on the basis of product type, the cupboards segment was valued at $11,538.66 million in 2019, and is projected to reach $18,807.68 million by 2027, registering a CAGR of 6.05% from 2021 to 2027. This is attributed to increase in spending power of consumers, improvement in lifestyle, and launch of innovative cupboards with elegant designs are expected to increase their demand. Furthermore, increase in preference toward smaller homes and apartments due to hike in land prices & rents is likely to boost the demand for customized cupboards.

According to U.S. home furniture and bedding market forecast and trends, on the basis of sales channel, the online segment is estimated to reach $88,662.14 million by 2027, exhibiting at a CAGR of 3.06%, due to increase in adoption of various online portals for furniture shopping and rise in number of offers or discounts provided by these sites, which attracts a large consumer base to purchase home furniture through online channels. Moreover, online sales channels have increased consumer reach, owing to which it has evolved as a key source of revenue for many companies.

Request The Free Sample PDF Of This Report (Flash Sale Till 20th August 2022) @https://www.alliedmarketresearch.com/request-sample/11319

Furthermore, the online sales market is expected to expand in the future, owing to rapid adoption of the e-commerce platform by consumers and furniture manufacturing and retail companies and technical improvements in online selling platforms such as chatbots, voice assistants, augmented & virtual reality, blockchain technology, and drones & droids. For instance, chatbots is new virtual support service drones & droids are next level delivery systems.

However, increase in cost of raw material owing to stringent laws and conditions imposed by the U.S. government under State Forestry Laws, is likely to hinder the U.S. home furniture and bedding market growth during the forecast period. Forestry Law relates to all statutes and regulations that deal with the preservation of forests and parks, Forestry Law relates to all statutes and regulations that deal with the preservation of forests and parks, reforestation activities to ensure the sustainability of the nation’s lands, and the prevention of illegal logging activities. These laws derive from both federal and state sources. Other than wood as raw material for furniture, steel, glass, plastic and fiber has been gaining considerable traction among the people owing to benefits associated such as long durability, more aesthetic appearance and environment friendly.

The players operating in the U.S. home furniture and bedding industry have adopted product launch and business expansion as their key developmental strategies to expand their market share, increase profitability, and remain competitive in the market.

The key market players profiled in the report include:

• Steelcase
• HNI Corporation
• Herman Miller
• Sleep Number Corporation
• La-Z-Boy Inc.
• Tempur Sealy International Inc.
• Serta Simmons Bedding LLC
• Sauder Woodworking Company
• Ashley Furniture Industries
• Hooker Furniture Corporation.

Need a Discount? Getting Exclusive Discount And Free Consultation: @https://www.alliedmarketresearch.com/purchase-enquiry/11319

Key Benefits For Stakeholders:

○ The report provides a quantitative analysis of the current market trends, estimations, and dynamics of the market size from 2019 to 2027 to identify the prevailing opportunities.
○ Porter’s five forces analysis highlights the potency of buyers and suppliers to enable stakeholders to make profit-oriented business decisions and strengthen their supplier–buyer network.
○ In-depth analysis and the market size and segmentation assist to determine the prevailing market opportunities.
○ The major countries in each region are mapped according to their revenue contribution to the market.
○ The market player positioning segment facilitates benchmarking and provides a clear understanding of the present position of the market players in the U.S. home furniture and bedding industry.

Reasons to Buy This U.S. Home Furniture and Bedding Market Report:

○ Mergers and acquisitions should be well-planned by identifying the best manufacturer.
○ Sort new clients or possible partners into the demographic you’re looking for.
○ Suitable for providing dependable and high-quality data and analysis to assist your internal and external presentations.
○ Develop tactical initiatives by gaining a better grasp of the areas in which huge corporations can intervene.
○ To increase and grow business potential and reach, develop and plan licencing and licencing strategies by finding possible partners with the most appealing projects.
○ Recognize newcomers with potentially strong product portfolios and devise effective counter-strategies to acquire a competitive edge.
○ To develop effective R&D strategies, gather information, analysis, and strategic insight from competitors.

Related Reports:

○ Plastic Furniture Market is projected to reach $19,075.3 million by 2027
○ Children Furniture Market is projected reach $48.9 billion by 2030

About Allied Market Research:

Allied Market Research (AMR) is a full-service market research and business-consulting wing of Allied Analytics LLP based in Portland, Oregon. Allied Market Research provides global enterprises as well as medium and small businesses with unmatched quality of “Market Research Reports” and “Business Intelligence Solutions.” AMR has a targeted view to provide business insights and consulting to assist its clients to make strategic business decisions and achieve sustainable growth in their respective market domain.

Contact us:

David Correa
5933 NE Win Sivers Drive
205, Portland, OR 97220
United States
USA/Canada (Toll Free):
+1-800-792-5285, +1-503-894-6022|
UK: +44-845-528-1300 |
Hong Kong: +852-301-84916 |
India (Pune): +91-20-66346060 |
Fax: +1-855-550-5975
Email: help@alliedmarketresearch.com

Why Ecotourism is Booming: A Scientometric Review of the Global Market Research

According to a new report published by Allied Market Research, titled, “The ecotourism market size was $181.1 billion in 2019, and is projected reach $333.8 billion by 2027, registering a CAGR of 14.3% from 2021 to 2027.

Surge in travel and tourism toward unique attractions, preference for exploration of wildlife, coral reefs, and remote natural areas, and focus on sustainability fuel the global ecotourism market. Asia-Pacific held the highest market share in 2019, and will maintain its lead position by 2027. Travel ban across the world stopped exploration activities for new destinations and sightseeing. The public transportation means including buses, trains, and air have been banned.

LIMITED-TIME OFFER – Buy Now & Get Exclusive Discount on this Report

Increase in travel and tourism to unique destinations, inclination toward exploration of wildlife, coral reefs, and pristine undisturbed natural areas, and surge in focus on sustainability drive the global ecotourism market. However, low availability of accommodation and limited availability of quality and hygienic restaurants at destinations hinder the market growth. On the other hand, public-private partnerships in the form of subsidizing air routes to remote tourist destinations, improvement of transport capabilities, and providing ease of access create new opportunities in the coming years.

Surge in travel and tourism toward unique attractions, preference for exploration of wildlife, coral reefs, and remote natural areas, and focus on sustainability fuel the global ecotourism market. However, lack of proper accommodation and scarcity of quality and hygienic restaurants at destinations restrain the market growth. On the other hand, improvement of transport capabilities, formation of public-private partnerships for subsidizing air routes to remote destinations, and offering ease of access present new opportunities in the coming years.

By age group, the generation Y segment contributed to the highest share in 2019, accounting for nearly three-fifths of the global ecotourism market, and is expected to maintain its dominance in terms of revenue during the forecast period. However, the generation Z segment is projected to register the largest CAGR of 15.6% from 2021 to 2027.

Request The Free Sample PDF Of This Report @https://www.alliedmarketresearch.com/request-sample/6729

By traveler type, the group segment accounted for the largest market share, contributing to nearly four-fifths of the total market share in 2019, and will maintain its lead position during the forecast period. However, the solo segment is projected to manifest the fastest CAGR of 15.9% from 2021 to 2027.

Geographically, The rise of travel and tourism to unique destinations has shown significant resilience globally. Iceland, Kenya, Palau, and Nepal are the trending hotspots in unique eco-tourism destinations across the globe. North America is estimated to portray the highest CAGR of 16.2% during the forecast period. However, Asia-Pacific held the highest market share in 2019, contributing to nearly two-fifths of the market, and will maintain its lead position by 2027.

Leading players of the global ecotourism market analyzed in the research includeTravel Leaders Group, LLC, FROSCH International Travel, Inc., Aracari Travel, Adventure Alternative, Undiscovered Mountains Ltd., Intrepid Group Limited, G Adventures, Rickshaw Travel Group, Steppes Travel, and Small World Journeys Pty Ltd.

The Covid-19 pandemic has a vital impact on the growth of the global Ecotourism Market and altered several market scenarios. The lockdown across various countries and ban on international travel has disrupted the supply chain and revenue chain. The report includes a thorough analysis of the Covid-19 pandemic on the growth of the global Ecotourism Market.

Need a Discount? Getting Exclusive Discount And Free Consultation @https://www.alliedmarketresearch.com/purchase-enquiry/6729

Reasons to Buy This Ecotourism Market Report:

• Mergers and acquisitions should be well-planned by identifying the best manufacturer.
• Sort new clients or possible partners into the demographic you’re looking for.
• Suitable for providing dependable and high-quality data and analysis to assist your internal and external presentations.
• Develop tactical initiatives by gaining a better grasp of the areas in which huge corporations can intervene.
• To increase and grow business potential and reach, develop and plan licencing and licencing strategies by finding possible partners with the most appealing projects.
• Recognize newcomers with potentially strong product portfolios and devise effective counter-strategies to acquire a competitive edge.
• To develop effective R&D strategies, gather information, analysis, and strategic insight from competitors.

Related Reports:

• Wellness Tourism Market Will Show An Increase Of By 2027, Report
• Sustainable Tourism Market Opportunities And Revenue Forecast By 2027


About Allied Market Research:

Allied Market Research (AMR) is a full-service market research and business-consulting wing of Allied Analytics LLP based in Portland, Oregon. Allied Market Research provides global enterprises as well as medium and small businesses with unmatched quality of “Market Research Reports” and “Business Intelligence Solutions.” AMR has a targeted view to provide business insights and consulting to assist its clients to make strategic business decisions and achieve sustainable growth in their respective market domain.

Contact us:

David Correa
5933 NE Win Sivers Drive
205, Portland, OR 97220
United States
USA/Canada (Toll Free):
+1-800-792-5285, +1-503-894-6022|
UK: +44-845-528-1300 |
Hong Kong: +852-301-84916 |
India (Pune): +91-20-66346060 |
Fax: +1-855-550-5975
Email: help@alliedmarketresearch.com

Cleaning Products Market to Grow Rapidly in U.S Region; Market to Cross $2,898.5 million by 2030

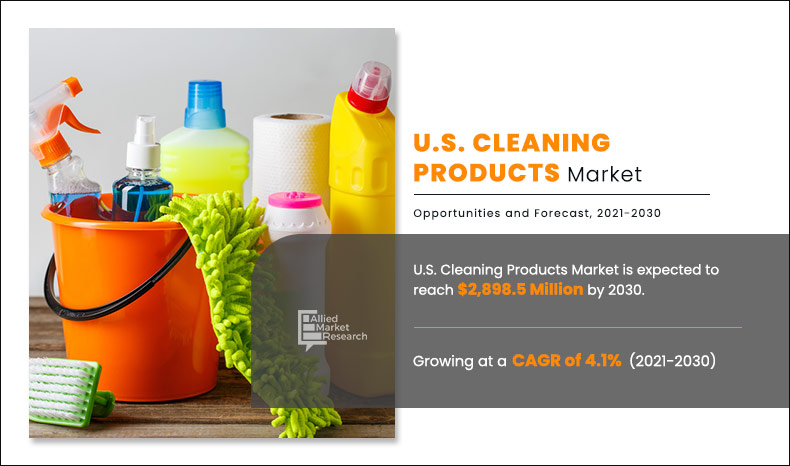
 According to a new report published by Allied Market Research, titled, “U.S. Cleaning Products Market by Type: Opportunity Analysis and Industry Forecast, 2021–2030,” the U.S. cleaning products market was valued at $1,957.9 million in 2020, and is projected reach $2,898.5 million by 2030, registering a CAGR of 4.1% from 2021 to 2030 Brooms generated the highest revenue in 2020. California accounted for around approximately 13% share of the U.S. cleaning products market in 2020, and is anticipated to exhibit notable growth in the coming years. Economic upsurge, increased disposable income, and rise in dual-income households have improved the adoption of new and innovative brooms and mops in the U.S. cleaning products market, fueling the U.S. cleaning products market growth. In addition, growth in commercial sector and investment in real estate are anticipated to drive the demand for these products. However, high competition majorly in high populated states such as California and Texas is one of the major factors that restrains the growth of U.S. cleaning products industry.

LIMITED-TIME OFFER – Buy Now & Get Exclusive Discount on this Report

Key Market Players
– BRUSH RESEARCH MANUFACTURING CO INC
– PROCTER & GAMBLE COMPANY
– CARLISLE SANITARY MAINTENANCE PRODUCTS INC
– GORDON BRUSH MFG. CO., INC.
– THE LIBMAN COMPANY
– WEILER CORPORATION
– CAROLINA MOP MANUFACTURING CO
– PERFEX CORPORATION
– AMERICAN TEXTILE & SUPPLY, INC
– MALISH CORPORATION

On the basis of product type, the U.S. cleaning products market is classified into brooms, mops, brushes, and others. The big box retailers accounted for the largest market share of approx. 32% in 2020. However, the others (online retailers) segment is expected to register the highest growth rate of 6.6% CAGR. The e-commerce platforms are booming all across the world and US is one of the prominent countries to support online retailing. The consumers in the country are also preferring online shopping owing to the ease of access and home delivery facilities.

The U.S. cleaning products market is classified into several states in the country such as Washington, Oregon, Massachusetts, Colorado, California, Florida, Texas, and rest of the U.S. By state, California accounted for majority of the share in the market in 2020, and is expected to maintain its dominance due to increase in number of households and rise in GDP in the market. However, Oregon is expected to show the highest growth rate, owing to increased disposable income of individuals, thus. creating growth opportunities for competitors.

Technological advancements are becoming one of the major needs among manufacturers in different industries. This is due to the rise in consumer inclination toward innovative and electronic durables which are replacing the conventional products in the market. These factors coupled with increasing innovations in the market shaping the U.S. cleaning products market trends among the consumers. The manual cleaning products market is one of the markets which is expected to be hampered by electronic mops, vacuum cleaners, and others.

Request The Free Sample PDF Of This Report (Flash Sale Till 20th August 2022):- https://www.alliedmarketresearch.com/request-sample/14679

Key Findings Of The Study

By product type segment, the broom segment accounted for the highest U.S. cleaning products market share in 2020, growing at a CAGR of 4.2% and brushes was the fastest growing type with a CAGR of 4.6% between the years 2021 and 2030
By distribution channel, the big box retailers segment accounted for about 30% of market share in 2020. However, the others category is expected to grow at a higher CAGR of 6.6% during the period of U.S. cleaning products market forecast, owing to the rapid expansion of online retailers in the market
By state, California accounted for about 12.4% of the overall U.S. cleaning products market size by share and is expected to grow at a CAGR of 2.9% during the forecast period
Online sales channels are expected to gain prominence in the upcoming years.

Reasons to Buy This U.S. Cleaning Products Market Report:

> Mergers and acquisitions should be well-planned by identifying the best manufacturer.

> Sort new clients or possible partners into the demographic you’re looking for.

> Suitable for providing dependable and high-quality data and analysis to assist your internal and external presentations.

> Develop tactical initiatives by gaining a better grasp of the areas in which huge corporations can intervene.

> To increase and grow business potential and reach, develop and plan licencing and licencing strategies by finding possible partners with the most appealing projects.

> Recognize newcomers with potentially strong product portfolios and devise effective counter-strategies to acquire a competitive edge.

> To develop effective R&D strategies, gather information, analysis, and strategic insight from competitors

𝗥𝗲𝗾𝘂𝗲𝘀𝘁 𝗙𝗼𝗿 𝗖𝘂𝘀𝘁𝗼𝗺𝗶𝘇𝗮𝘁𝗶𝗼𝗻 (Flash Sale Tell 20th August 2022):- https://www.alliedmarketresearch.com/request-for-customization/14679

FREQUENTLY ASKED QUESTIONS?
Q1. What is the total market value of the U.S. Cleaning Products Market report?
Q2. What would be the forecast period in the U.S. Cleaning Products Market report?
Q3. Which is the base year calculated in the U.S. Cleaning Products Market report?
Q4. Which are the top companies hold the market share in the U.S. Cleaning Products Market?
Q5. Which is the most influencing segment growing in the U.S. Cleaning Products Market report?

David Correa
5933 NE Win Sivers Drive
#205, Portland, OR 97220
United States
USA/Canada (Toll Free):
+1-800-792-5285, +1-503-894-6022
UK: +44-845-528-1300
Hong Kong: +852-301-84916
India (Pune): +91-20-66346060
Fax: +1(855)550-5975
help@alliedmarketresearch.com
Web: 
www.alliedmarketresearch.com 
Allied Market Research Blog: https://blog.alliedmarketresearch.com 
Follow Us on
 | Facebook | Twitter | LinkedIn |

Sustainable Toys Market Expected to reach $59,643.9 million by 2030

quote Increased awareness regarding hazardous effects of toxic chemicals used in the toys and increasing concern about climate and environment are majorly driving the growth of the sustainable toys market during the forecast period. quote

According to a new report published by Allied Market Research, titled, “Sustainable Toys Market by Product Type, Age Group and Distribution Channel: Global Opportunity Analysis and Industry Forecast, 2021-2030,

The sustainable toys market size is expected to reach $59,643.9 million by 2030, registering a CAGR of 8.2% from 2021 to 2030.

Sustainable toys, also known as green toys or recycled toys are majorly made up of organic cotton, wool, beeswax, cork, bamboo and water based inks. Rise in environmental consciousness among the customers and rapid expansion of the retail sector is likely to propel the sustainable toys market growth during the forecast period. Plastic is known to be one of the most non-degradable substances used in the toy manufacturing. To prevent the environmental issue, the rising concern about global warming and government regulation regarding the use of plastic has been contributing for the growth of the sustainable toys market. Furthermore, government regulations regarding the use chemicals in toys and development of an eco-label certification program for toys are supporting for the growth of market.

High internet penetration and highly addicting online games on smartphones and tablets have enormously hampered the toys market. Easy availability of high addicting gadgets, such as smartphones, video games, and computers, poses significant challenge for the toys market in the coming years.

LIMITED-TIME OFFER – Buy Now & Get Exclusive Discount on this Report

The outbreak of the pandemic has positively impacted the global sustainable toys market. During lockdown period everyone, including children, stuck in their homes. So parents brought toys and games for their kids for entertainment. Furthermore, shortage of raw materials might pose challenges for stakeholders in the industry. Players who are sourcing materials locally are at a much better position.

According to the sustainable toys market analysis, the sustainable toys market segmented into type, product type, distribution channel, age group and region. On the basis of product type, the market is categorized into action figures, building sets, dolls, games/puzzles, sports and outdoor toys and others. On the basis of age group, the market is segmented into, up to 5 years, 5 to 10 years and above 10 years. By distribution channel, market is categorized into, hypermarket/supermarket, specialty stores, departmental stores, online channels and other. Region wise, it is analyzed across North America (the U.S., Canada, and Mexico), Europe (UK, Germany, France, Italy, Spain, Russia and Rest of Europe), Asia-Pacific (China, India, Japan, ASEAN, Australia and Rest of Asia-Pacific), and LAMEA (Brazil, Saudi Arabia, South Africa and Rest of LAMEA).

On the basis of product type, dolls segment has been gaining significant share in global sustainable toys market and is estimated to reach $11,315.2 million by 2030 at a CAGR of 11.9%. Sustainable doll toy and game manufacturers are thus increasingly investing in traditional toys such as microscopes, modelling clay and magic kits to keep up with the growing demand from parents. Furthermore, the company is introducing new packaging, such as L.O.L. Surprise!, wherein dolls come inside opaque packaging, so kids don’t know what they are getting until the toy is fully unwrapped. Sustainable dolls are majorly made up of cotton, wool, and water based inks which are non-hazardous for kids health, which further contributes for the growth of the market during the forecast period. 

According to the sustainable toys market forecast, on the basis of age group, the 5 to 10 years segments accounted for around 39.7% market share in 2020, with and is expected to grow at CAGR of 13.1% during the forecast period. 5 to 10 years age group kids has tremendous explosion in the learning ability. Thus, parent are increasing focusing on providing educational toys including STEM toys. STEM is short form of Science, Technology, Engineering and Math. STEM toys encourage kids to learn more about these 4 subjects. In this age group, children are increasingly using smartphones for education and playing purposes is likely to hinder the growth of the sustainable toys market during the forecast period    

Request The Free Sample PDF Of This Report (Flash Sale Till 20th August 2022):- https://www.alliedmarketresearch.com/request-sample/14237

According to the sustainable toys market trends, on the basis of distribution channel, the online channels segment is growing at highest CAGR growth rate and is estimated to reach $7,863.2 million by 2030. The online sale of sustainable toys is likely to gain significant traction in the upcoming years. Consumers can obtain access to products manufactured in a different country through online retail. Consumers who demand a product from a specific brand but do have access to the physical store can easily purchase it from online portals. Therefore, online stores enable attaining a larger consumer base across the world. It is regarded as the fastest growing sales channel in the global market.

According to the sustainable toys market opportunities, region wise, Asia-Pacific market is expected to witness significant growth at a CAGR of 13.3% during the forecast period. Asia-Pacific is the fastest growing and developing region with numerous emerging economies, including but not limited to India, China, Vietnam, and Indonesia. With rapid urbanization, digitalization, and emergence of modern retail channels, the Asia-Pacific region is expected to offer lucrative opportunities to the engaged stakeholders. Furthermore, growing parents awareness about hazardous effects of toxic chemicals in toys, which further encourage parents to buy sustainable toys for their kids in the Asia Pacific region.

The players operating in the sustainable toys industry have adopted product launch and business expansion as their key developmental strategies to expand their market, increase profitability, and remain competitive in the market. The key players profiled in this report include Eco Kids, Le Toy Van, Green Toys, Legler, Tegu, PlanToys, LEGO, Hasbro, GOLIATH GAMES and CLEMENTONI.

Key Findings Of The Study 

  • The sustainable toys market size was valued at $18,940.0 million in 2020, and is estimated to reach $59,645.1 million by 2030, registering a CAGR of 12.5% from 2021 to 2030. 
  • By type, the action figures segment is estimated to witness the significant growth, registering a CAGR of 15.2% during the forecast period.
  • By age group, the Up to 5 years segment is estimated to witness the significant growth, registering a CAGR of 11.7% during the forecast period.
  • In 2020, depending on distribution channel, the hypermarket/supermarket segment was valued at $5,423.50 million, accounting for 28.6% of the global sustainable toys market share.
  • In 2020, the US was the most prominent market in North America, and is projected to reach $14,738.50 million by 2030, growing at a CAGR of 11.7% during the forecast period.

𝗥𝗲𝗾𝘂𝗲𝘀𝘁 𝗙𝗼𝗿 𝗖𝘂𝘀𝘁𝗼𝗺𝗶𝘇𝗮𝘁𝗶𝗼𝗻 (Flash Sale Tell 20th August 2022):- https://www.alliedmarketresearch.com/request-for-customization/14237

David Correa
5933 NE Win Sivers Drive
#205, Portland, OR 97220
United States
USA/Canada (Toll Free):
+1-800-792-5285, +1-503-894-6022
UK: +44-845-528-1300
Hong Kong: +852-301-84916
India (Pune): +91-20-66346060
Fax: +1(855)550-5975
help@alliedmarketresearch.com
Web: 
www.alliedmarketresearch.com 
Allied Market Research Blog: https://blog.alliedmarketresearch.com 
Follow Us on
 | Facebook | Twitter | LinkedIn |

Pet Furniture Market is projected to reach $5,139.4 million by 2027, growing at a CAGR of 6.5% from 2021 to 2027

According to a new report published by Allied Market Research titled, “Pet Furniture Market By Product Type, Pet Type, And Distribution Channel: Opportunities and Forecasts, 2021-2027,” the global pet furniture market size was valued at $3,443.4 million in 2019, and is projected to reach $5,139.4 million by 2027, growing at a CAGR of 6.5% from 2021 to 2027. In 2019, North America accounted for the largest share of around 38.6% due to rise in health hygiene expenditure of pet animals, and well-established health care facilities for pets in this region. . However, emerging countries in Asia, such as China and India, would witness increase in demand for pet furniture during the forecast period, owing to increase in awareness for comfort towards pets, rise in number of employed households, and growth in disposable income. 

Growth in value sales for pet furniture industry is attributable to surge in demand for innovative products Beds & Sofa’s category, which facilitate better results. Pet furniture is noticeably popular and expanding with significant pace in developed regions of the Americas and Europe, where manufacturers are coming up with new product innovations considering pets health and comfort to help pet owners adopt to a lifestyle with good convenience. Dogs and cats’ segment are key to the performance of the market as compared to another segment. Advanced cost effective and customized furniture, rising concerns towards pet care, increase in health expenditure for animals as well as huge varieties in furniture for pet creates offers numerous pet furniture market opportunities.

LIMITED-TIME OFFER – Buy Now & Get Exclusive Discount on this Report

Brands such as Mid West Homes for Pets, Nest Bedding and North American Pet Products are bringing new line of pet furniture related to pets and are providing different varieties of pet furniture for consumers. Innovative product offerings with latest features such as multi functions and customized by global brands for specific target group such as young population and working families is increasing regional demand for pet furniture.  (Says AMR Analyst)

Pet furniture have witnessed higher rate of penetration in North America and Europe. However, low availability has been observed for these products in some major parts of Asia-Pacific and LAMEA, which is attributable to low performing macro-economic factors such as internet penetration and aggressive marketing strategies by the manufacturers. Thus, lower penetration of such products limits the pet furniture market growth.

For the purpose of pet furniture market analysis, the market is segmented into Houses, Beds & Sofas and Trees & Condos on the basis of product type. Among the three types, Houses accounted for a larger share of around 47.5% of the overall market in 2019. Also Houses segment is expected to capture a larger market share in 2027, owing to increase in demand for wide range of varieties. This pet furniture market segment is anticipated to witness faster growth in developed economies, and would account for 46.1% of the overall market by 2027.

The pet furniture market is segmented based on pet type, product type, and distribution channel. Depending on pet type, the market is divided into cat, dog and others. And depending on product type, the market is divided into Houses, Beds and sofas, Trees and condos. On the basis of distribution channel the market is segmented in specialty stores, supermarkets/hypermarkets, e-commerce, and others. On the basis of regions, the market is studied across North America, Europe, Asia-Pacific, and LAMEA. The Dog segment is expected to account for 46.1% of the overall market revenue by 2027. 

Request The Free Sample PDF Of This Report (Flash Sale Till 20th August 2022):– https://www.alliedmarketresearch.com/request-sample/11197

Key Findings Of The Study

  • In 2019, North America was the highest revenue-generating market, due to rise in health care expenditure and well-established health care facilities in this region
  • Europe has emerged to be the second largest market with France and Germany accounting for the prominent pet furniture market share of the overall market by value.
  • Houses has emerged to be the prominent segment due to increase in demand for wide range of varieties.
  • Asia-Pacific is expected to witness the fastest growth from 2019 to 2027, owing to increase in adoption of eco-friendly pet furniture in developing economies such as China and India

𝗥𝗲𝗾𝘂𝗲𝘀𝘁 𝗙𝗼𝗿 𝗖𝘂𝘀𝘁𝗼𝗺𝗶𝘇𝗮𝘁𝗶𝗼𝗻 (Flash Sale Tell 20th August 2022):- https://www.alliedmarketresearch.com/request-for-customization/11197

David Correa
5933 NE Win Sivers Drive
#205, Portland, OR 97220
United States
USA/Canada (Toll Free):
+1-800-792-5285, +1-503-894-6022
UK: +44-845-528-1300
Hong Kong: +852-301-84916
India (Pune): +91-20-66346060
Fax: +1(855)550-5975
help@alliedmarketresearch.com
Web: 
www.alliedmarketresearch.com 
Allied Market Research Blog: https://blog.alliedmarketresearch.com 
Follow Us on
 | Facebook | Twitter | LinkedIn |