The industry is facing significant challenges due higher availability of substitutes in the U.S. cleaning products market
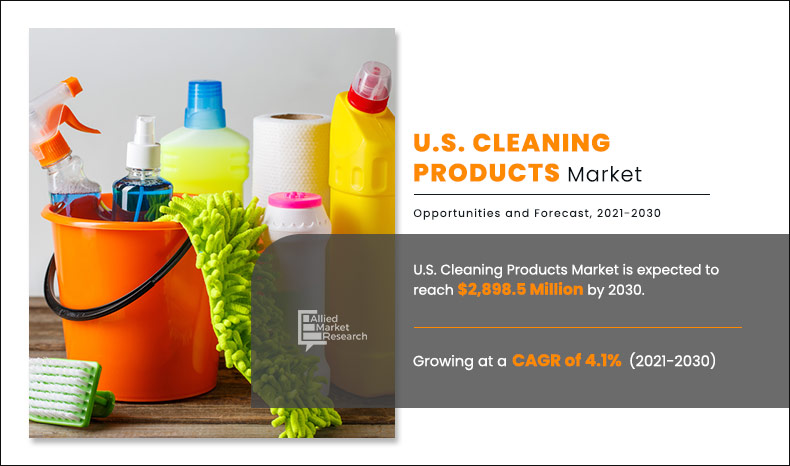
According to a new report published by Allied Market Research, titled, “U.S. Cleaning Products Market by Type: Opportunity Analysis and Industry Forecast, 2021–2030,” the U.S. cleaning products market was valued at $1,957.9 million in 2020, and is projected reach $2,898.5 million by 2030, registering a CAGR of 4.1% from 2021 to 2030
Brooms generated the highest revenue in 2020. California accounted for around approximately 13% share of the U.S. cleaning products market in 2020, and is anticipated to exhibit notable growth in the coming years. Economic upsurge, increased disposable income, and rise in dual-income households have improved the adoption of new and innovative brooms and mops in the U.S. cleaning products market, fueling the U.S. cleaning products market growth. In addition, growth in commercial sector and investment in real estate are anticipated to drive the demand for these products. However, high competition majorly in high populated states such as California and Texas is one of the major factors that restrains the growth of U.S. cleaning products industry.
On the basis of product type, the U.S. cleaning products market is classified into brooms, mops, brushes, and others. The big box retailers accounted for the largest market share of approx. 32% in 2020. However, the others (online retailers) segment is expected to register the highest growth rate of 6.6% CAGR.
The e-commerce platforms are booming all across the world and US is one of the prominent countries to support online retailing. The consumers in the country are also preferring online shopping owing to the ease of access and home delivery facilities.
Request For Sample :- https://www.alliedmarketresearch.com/request-sample/14679
The U.S. cleaning products market is classified into several states in the country such as Washington, Oregon, Massachusetts, Colorado, California, Florida, Texas, and rest of the U.S. By state, California accounted for majority of the share in the market in 2020, and is expected to maintain its dominance due to increase in number of households and rise in GDP in the market. However, Oregon is expected to show the highest growth rate, owing to increased disposable income of individuals, thus. creating growth opportunities for competitors.
Technological advancements are becoming one of the major needs among manufacturers in different industries. This is due to the rise in consumer inclination toward innovative and electronic durables which are replacing the conventional products in the market. These factors coupled with increasing innovations in the market shaping the U.S. cleaning products market trends among the consumers. The manual cleaning products market is one of the markets which is expected to be hampered by electronic mops, vacuum cleaners, and others.
Key Findings Of The Study
By product type segment, the broom segment accounted for the highest U.S. cleaning products market share in 2020, growing at a CAGR of 4.2% and brushes was the fastest growing type with a CAGR of 4.6% between the years 2021 and 2030
By distribution channel, the big box retailers segment accounted for about 30% of market share in 2020. However, the others category is expected to grow at a higher CAGR of 6.6% during the period of U.S. cleaning products market forecast, owing to the rapid expansion of online retailers in the market
By state, California accounted for about 12.4% of the overall U.S. cleaning products market size by share and is expected to grow at a CAGR of 2.9% during the forecast period
Online sales channels are expected to gain prominence in the upcoming years.
Get detailed COVID-19 impact analysis on the U.s. Cleaning Products Market :- https://www.alliedmarketresearch.com/request-for-customization/14679?reqfor=covid
Some of the key players profiled in the U.S. cleaning products market analysis include Procter & Gamble, Gordon Brush Mfg. Co., Inc., The Libman Company, Weiler Corporation, Carolina Mop Manufacturing Co, Perfex Corporation, American Textile & Supply, Inc., Malish Corporation, Brush Research Manufacturing Co Inc., and Carlisle Sanitary Maintenance Products Inc.
FREQUENTLY ASKED QUESTIONS?
Q1. What is the total market value of the U.S. Cleaning Products Market report?
Q2. What would be the forecast period in the U.S. Cleaning Products Market report?
Q3. Which is the base year calculated in the U.S. Cleaning Products Market report?
Q4. Which are the top companies hold the market share in the U.S. Cleaning Products Market?
Q5. Which is the most influencing segment growing in the U.S. Cleaning Products Market report?
CHAPTER 1:INTRODUCTION
1.1.Report description
1.2.Key benefits for stakeholders
1.3.Key market segments
1.4.Research methodology
1.4.1.Primary research
1.4.2.Secondary research
1.4.3.Analyst tools and models
CHAPTER 2:EXECUTIVE SUMMARY
2.1.Key findings
2.1.1.Top impacting factors
2.1.2.Top investment pockets
2.2.CXO perspective
CHAPTER 3:MARKET OVERVIEW
3.1.Market definition and scope
3.2.Porter’s five forces analysis
3.2.1.Bargaining power of suppliers
3.2.2.Bargaining power of buyers
3.2.3.Threat of substitution
3.2.4.Threat of new entrants
3.2.5.Intensity of competitive rivalry
3.3.Top player positioning 2020
3.4.Market dynamics
FLASH SALE – Get Up To 25% Discount :- https://www.alliedmarketresearch.com/checkout-final/defa224ec3548ba566a8dcc02b28bb1b
3.4.1.Drivers
3.4.1.1.Rise in number of households in the US
3.4.1.2.High market penetration of cleaning products and rapid emergence of modern retail shops
3.4.2.Restraint
3.4.2.1.Availability of substitutes in the market
3.4.3.Opportunities
3.4.3.1.Increase in sales through online retails
3.5.Analysis on Impact of COVID-19
3.5.1.Overview
3.5.2.Multiple scenario
Similar Report :-
- Commercial Cooking Equipment Market https://www.alliedmarketresearch.com/commercial-cooking-equipment-market
- Hair Restoration Services Market https://www.alliedmarketresearch.com/hair-restoration-services-market
David Correa
5933 NE Win Sivers Drive
#205, Portland, OR 97220
United States
USA/Canada (Toll Free):
+1-800-792-5285, +1-503-894-6022
UK: +44-845-528-1300
Hong Kong: +852-301-84916
India (Pune): +91-20-66346060
Fax: +1(855)550-5975
help@alliedmarketresearch.com
Web: www.alliedmarketresearch.com
Allied Market Research Blog: https://blog.alliedmarketresearch.com
Follow Us on | Facebook | Twitter | LinkedIn |